State of Revenue Lifecycle Management
Report Design | Data Visualization
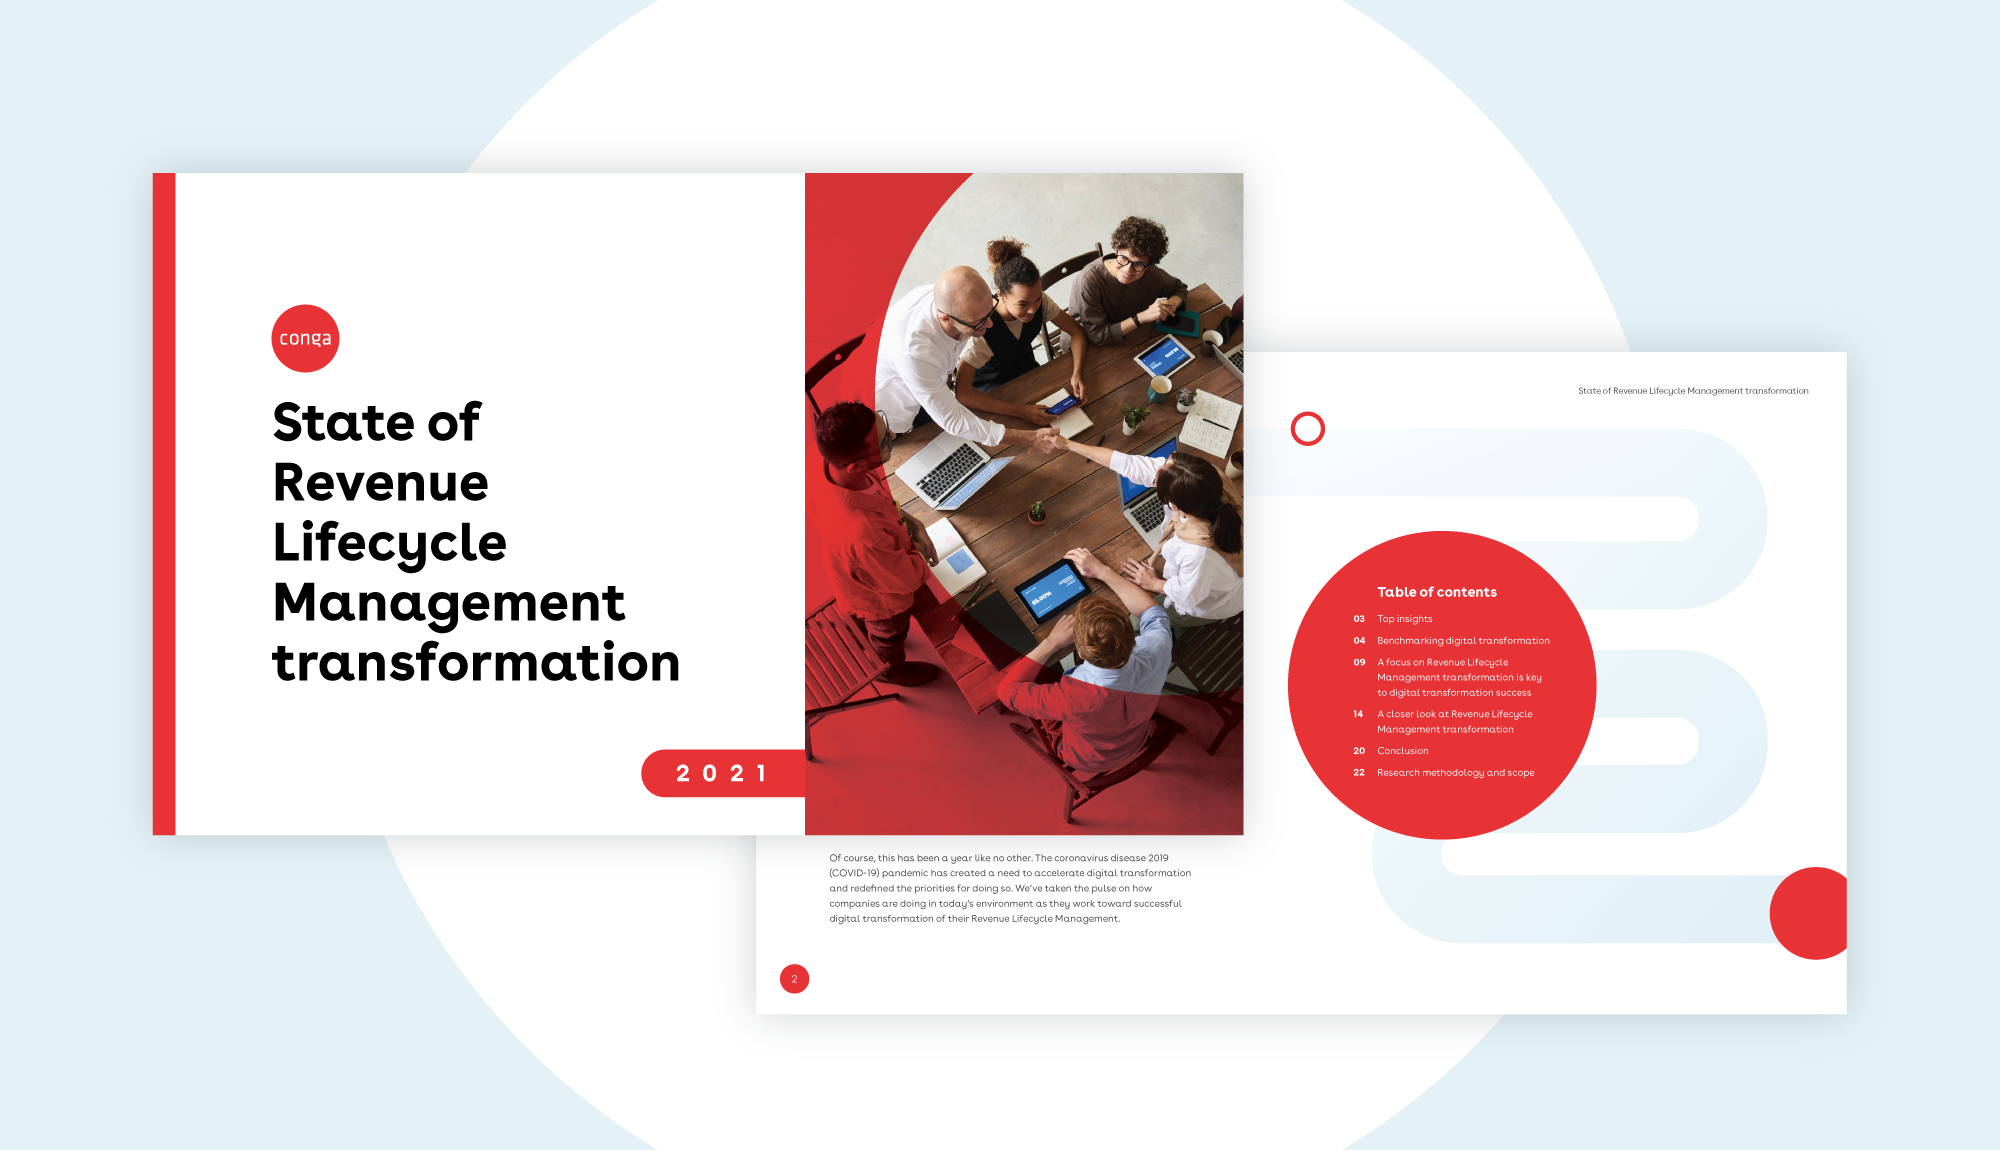
The State of Revenue Lifecycle Management Transformation is Conga’s annual report that takes a deep dive into digital transformation - what the benefits are, the fundamental focus areas, and how companies can see greater success through this transformation. Conga discovered that in the first year, the average conversion rate for downloads was 1.28%. However, the download rate for this report was 2.29%, indicating it performed much better than average.
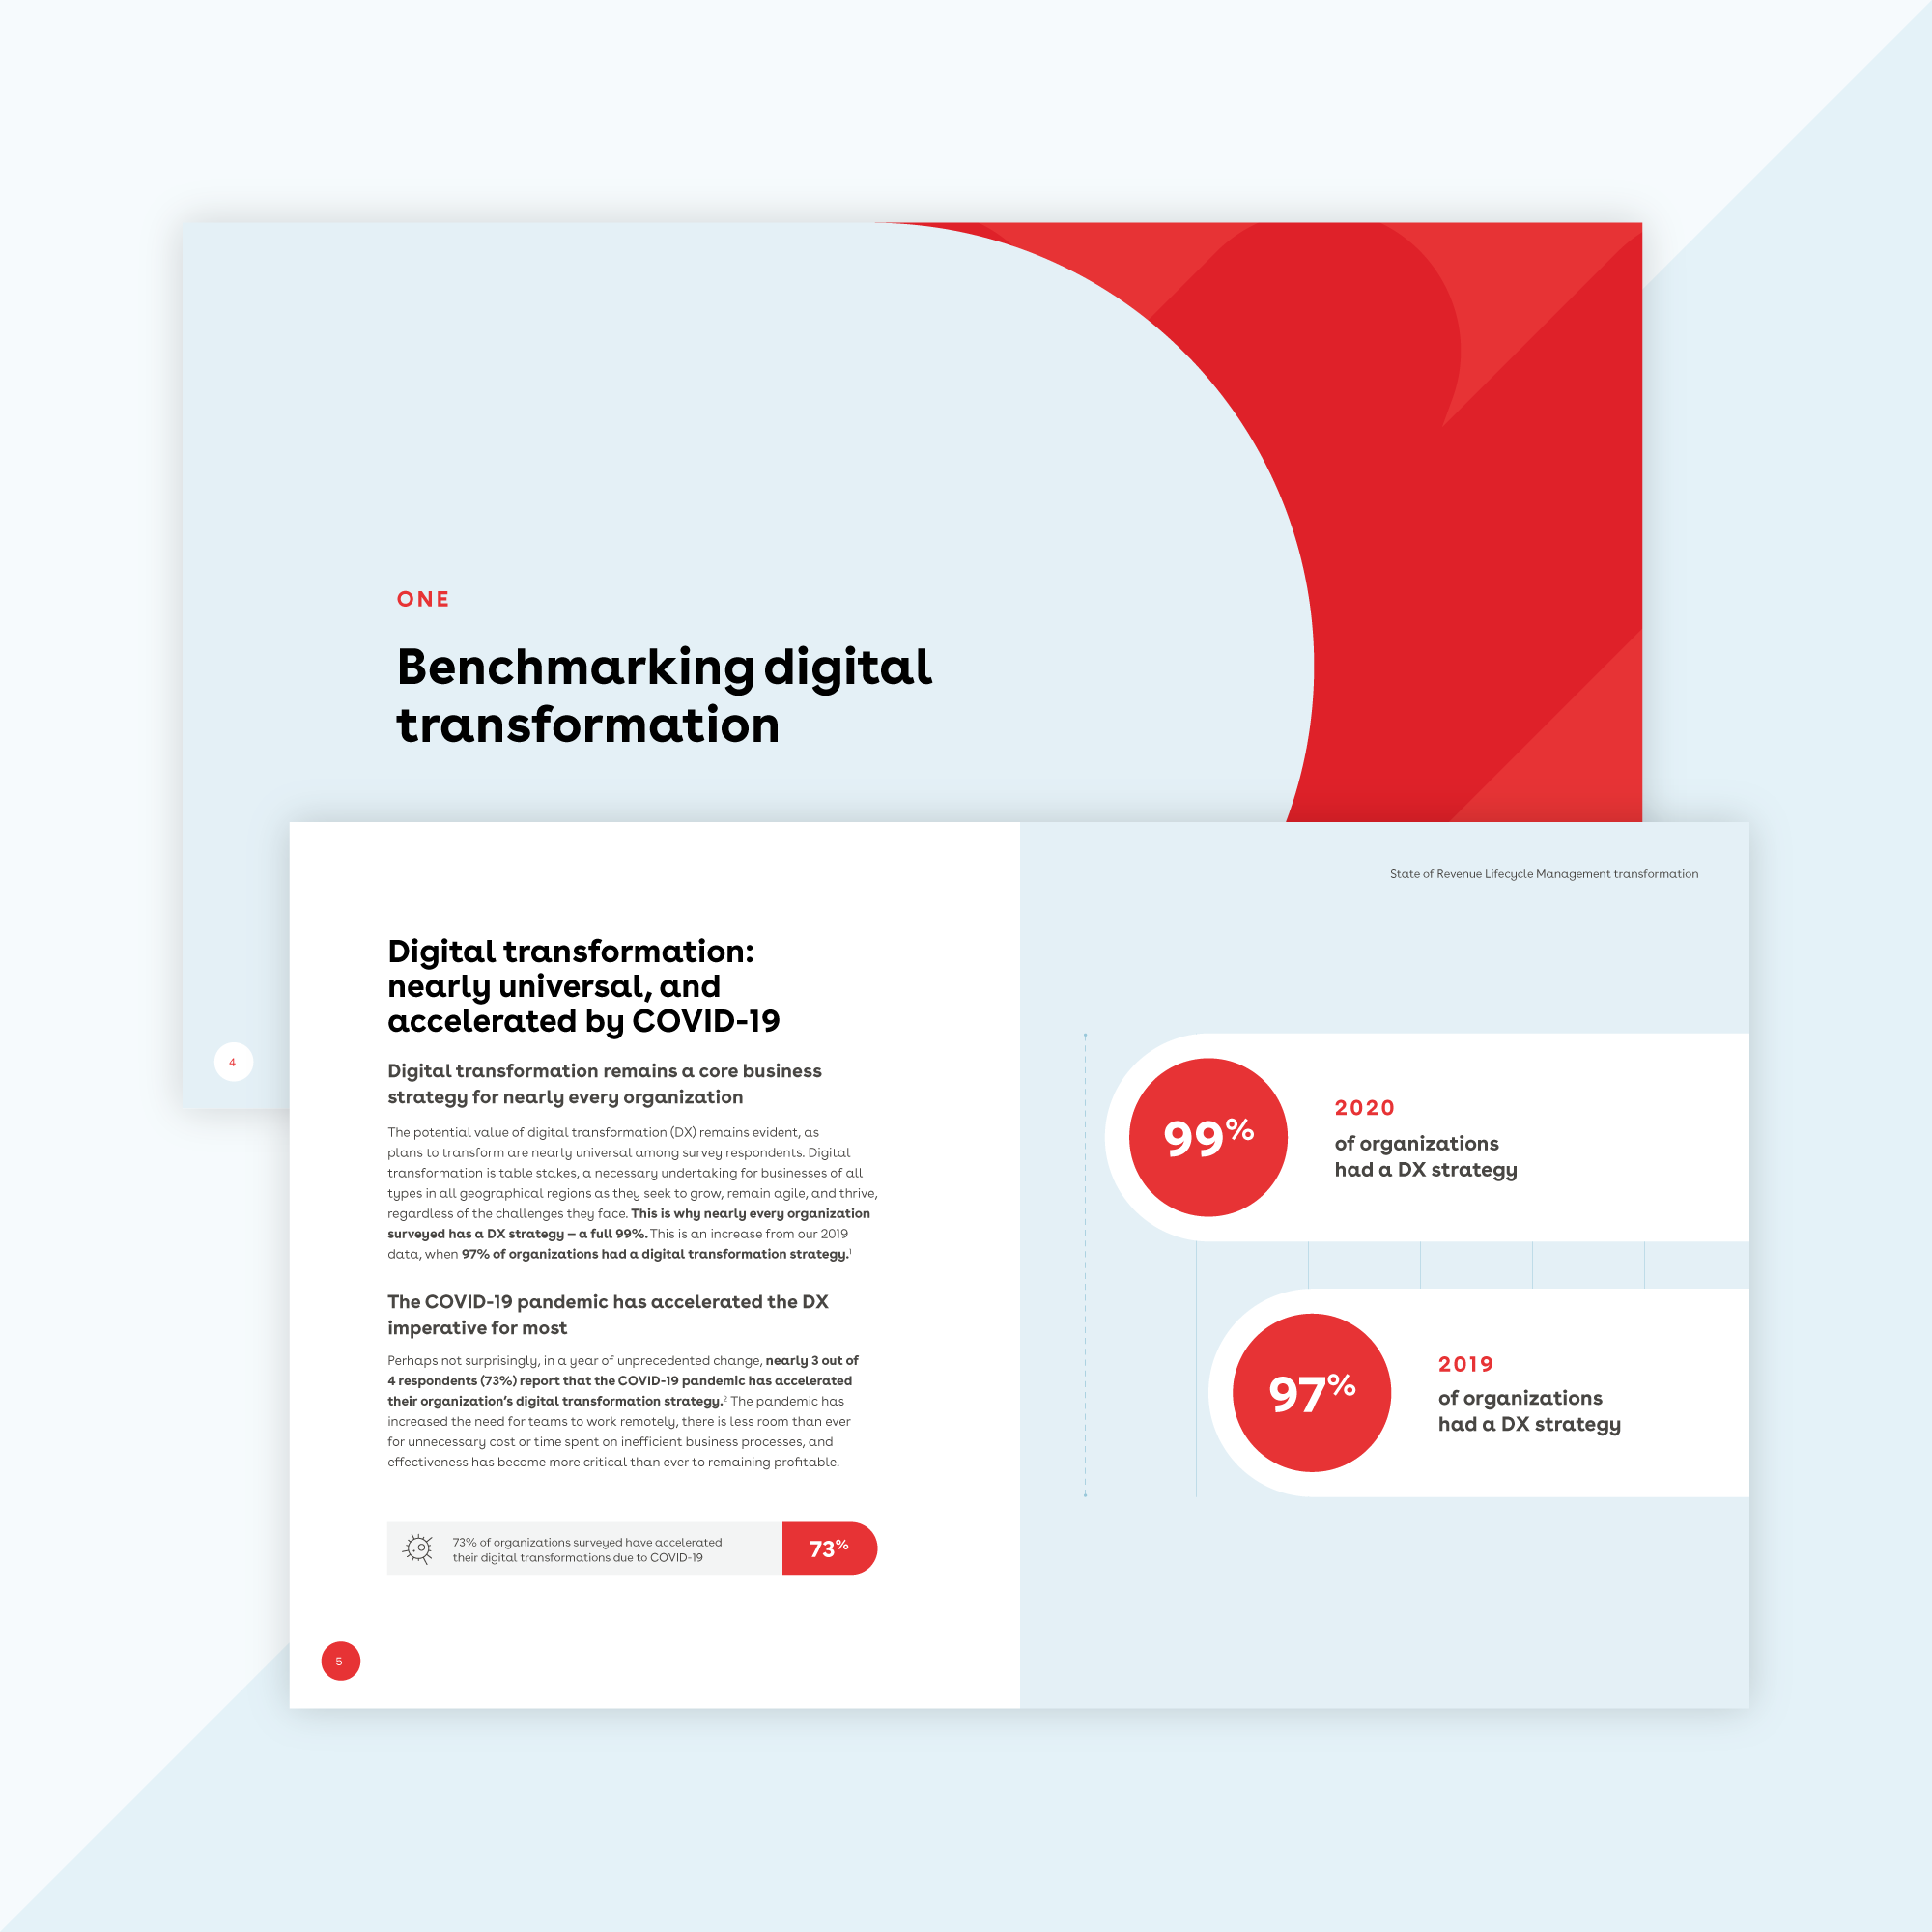
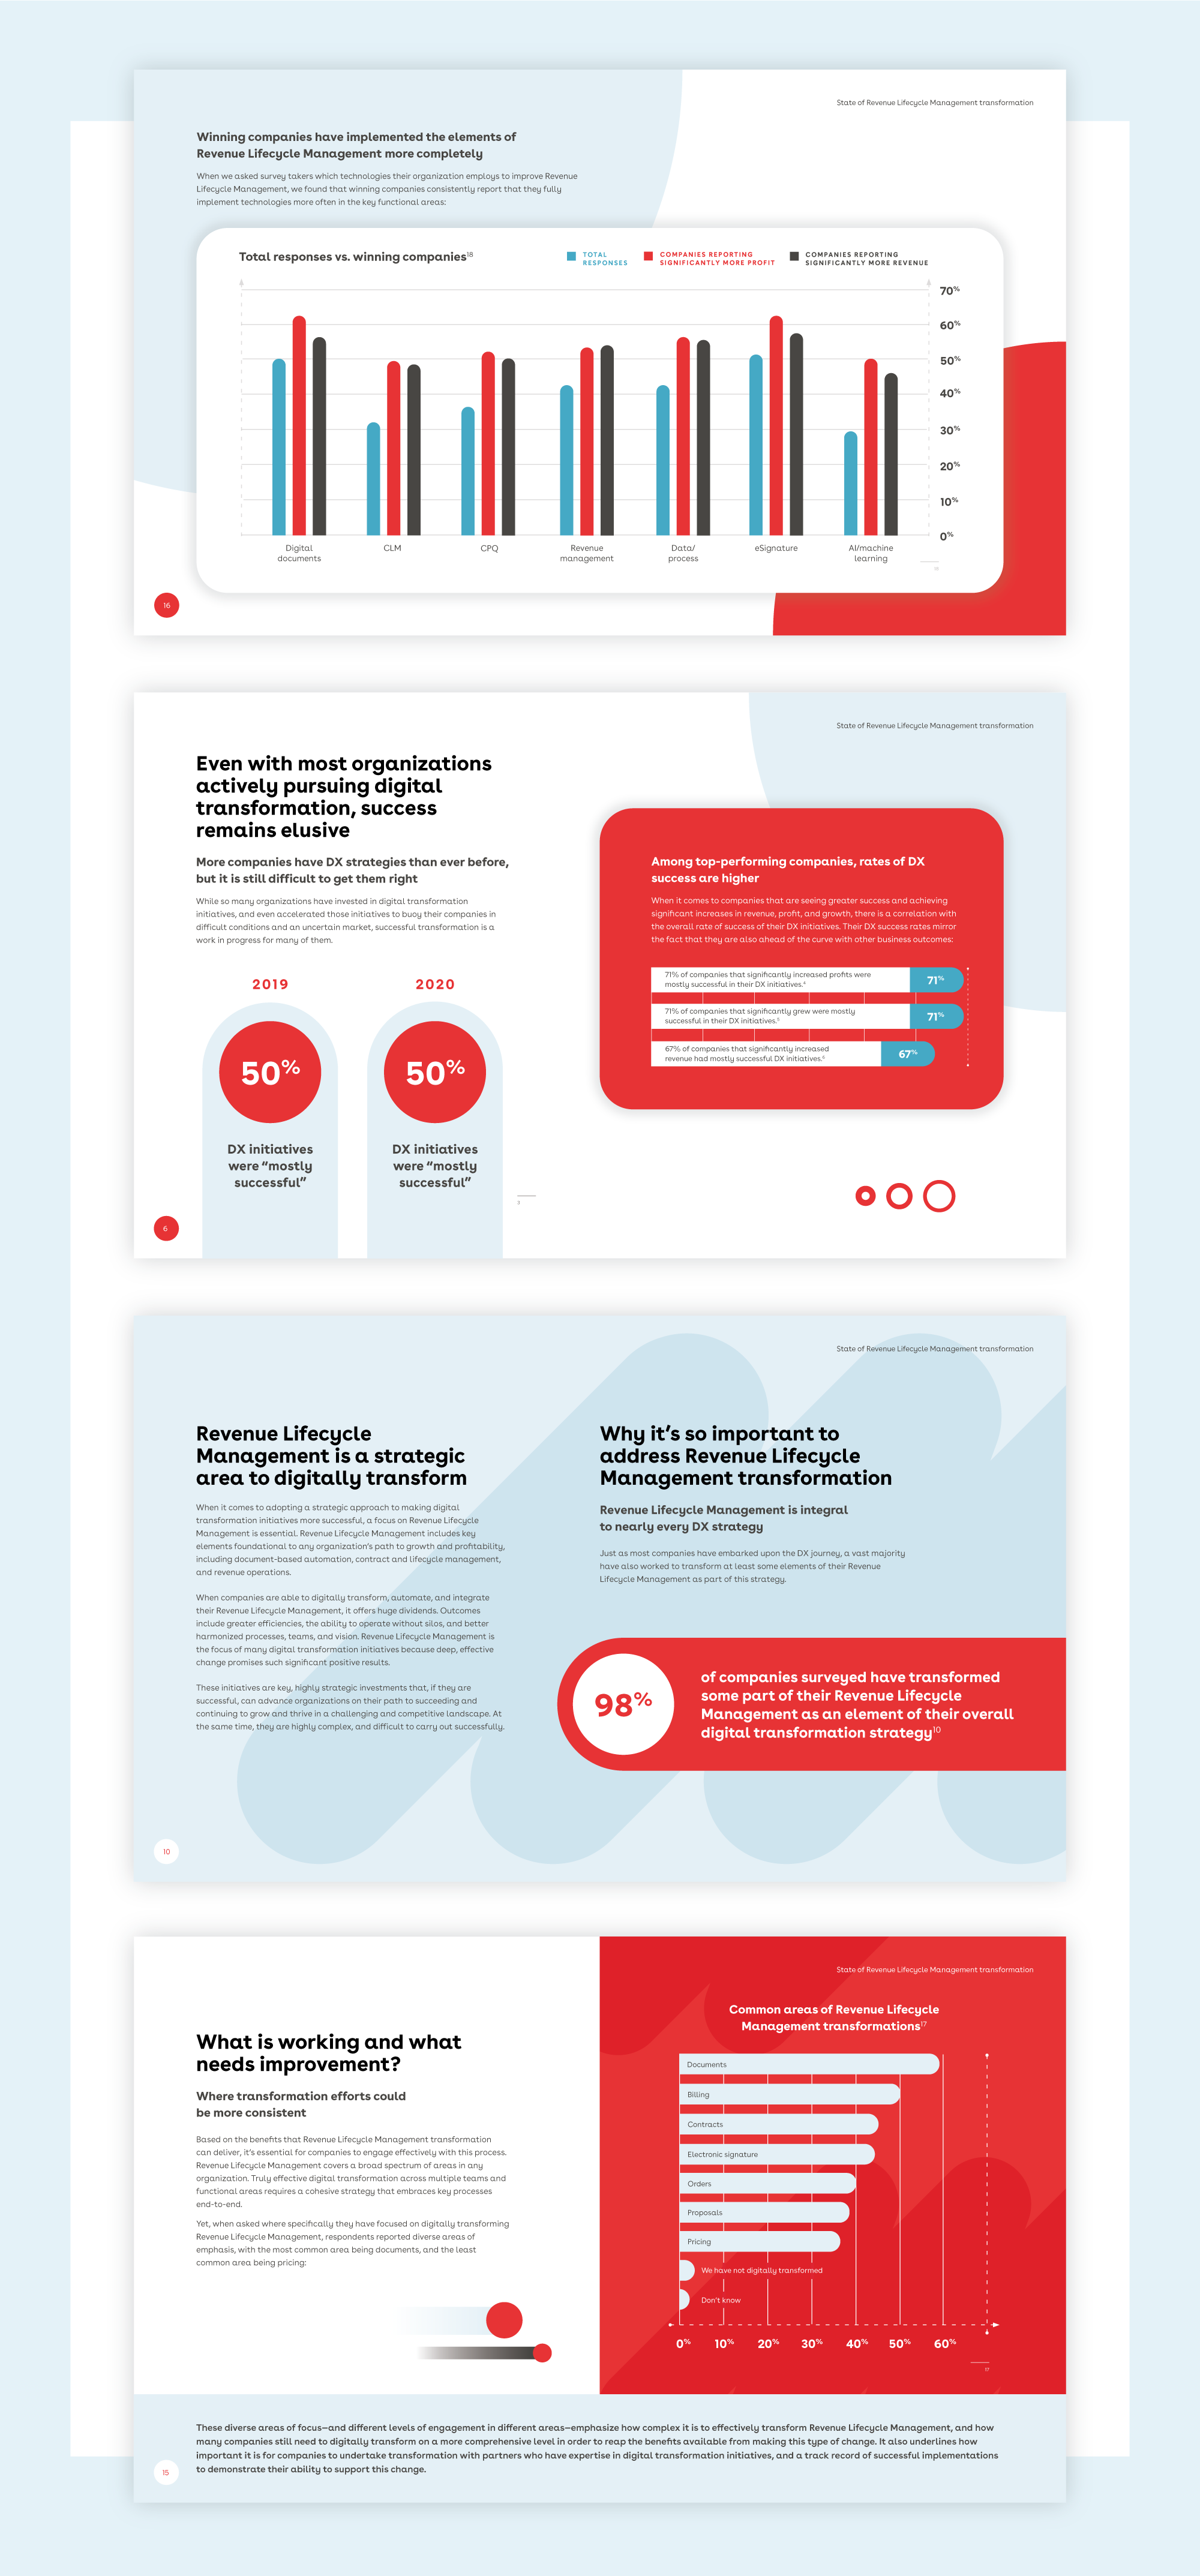
As one of Conga’s largest literature pieces, brimming with data and information, it was important to create a digestible but visually interesting report. The Conga brand calls for round and friendly shapes, so we applied the same approach to the charts and graphs. Additionally, this report established a style guide for data visuals for future reports and applications.